Instructors
FAQs
Course Feedback Dates
Using the Your Feedback System
Core SQCT Questions
Questionnaire Personalization
Supporting Your Feedback Response Rates
Your Feedback Classroom Administration
Helping Students Write Effective Feedback
Understanding Questionnaire Results
Accessing Past Results
Resources
Contact
Understanding Questionnaire Results
A main goal of Western's Your Feedback questionnaire on courses and teaching is to help instructors retain those
teaching practices that support student learning and provide feedback that can be used to inform potential
modifications to courses and instruction.
Student Questionnaire on Courses and Teaching (SQCT) results are meant to be seen as a form of constructive feedback
that provides insight into the ways in which students learn and interact with instructors and course materials,
promoting conversation, reflection, and action. Combined with
other indicators of instructional success,
questionnaire ratings results constructs a wider "picture" of individual instruction at Western, while questionnaire
comments provide a context for interpreting those results.
General Tips for Understanding Questionnaire Results
SQCTs provide one important source of feedback on courses and teaching: the students' perceived experience of the course.
This feedback should be reflected upon in conjunction with other sources of feedback (e.g., informal student feedback
collected throughout the course, self-reflection, peer review of teaching) when considering teaching.
It is also important to think about the context of a teaching experience when considering SQCT results. Perhaps you are
a new instructor, or are teaching a new course, or have tried out some new approaches to teaching or course design.
Maybe the course has undergone a substantial revision since it was last offered. Such contexts may influence questionnaire
responses, and can be discussed with a department Chair or Dean.
Research shows that upper level and smaller enrollment courses may have more positive ratings than lower level courses and
those with larger numbers. Elective courses may also have more positive ratings than required courses. It is helpful to
keep this in mind (Feldman, 2007; Hativa, 2014).
Set aside some dedicated time when you are in a positive state of mind to review your questionnaire results. Try not to
be defensive if your results are not as positive as you would like. The student questionnaire on courses and teaching is
meant to prompt self-reflection that can support your professional development as an instructor. Focus on those elements
of the questionnaire feedback that are positive and select one or two areas that you might consider improving in the
future, rather than trying to address all of the comments at once.
Tips for Understanding SQCT Rating Results
Table 1 provides an example of the Student Ratings Summary table from an SQCT Results Report. In the first column are shortened versions of the 11 core SQCT questions, followed by the total number of responses for that question (e.g., 219 students responded to question 1). The remaining seven columns reflect the number of students who selected each response option for that question (i.e., the frequencies) for each of the core SQCT questions.
Table: 1 Example Frequency Table from an SQCT Results Report
| Total Resp | Strongly Disagree (1) | Disagree (2) | Disagree Somewhat (3) | Neither Agree nor Disagree (4) | Agree Somewhat (5) | Agree (6) | Strongly Agree (7) | |
|---|---|---|---|---|---|---|---|---|
| 1. Displays enthusiasm | 219 | 2 | 4 | 7 | 39 | 61 | 72 | 34 |
| 2. Well organized | 219 | 1 | 1 | 0 | 21 | 52 | 84 | 60 |
| 3. Presents concepts clearly | 218 | 0 | 0 | 1 | 19 | 38 | 73 | 87 |
| 4. Encourages participation | 219 | 2 | 1 | 3 | 33 | 58 | 68 | 54 |
| 5. Responds to questions clearly | 219 | 11 | 24 | 40 | 68 | 50 | 22 | 4 |
| 6. Encourages reflection | 219 | 1 | 0 | 1 | 26 | 37 | 64 | 90 |
| 7. Provides fair evaluation | 217 | 0 | 2 | 9 | 36 | 39 | 31 | 100 |
| 8. Provides helpful feedback | 219 | 2 | 0 | 0 | 0 | 11 | 55 | 151 |
| 9. Good motivator | 219 | 1 | 5 | 4 | 37 | 32 | 59 | 81 |
| 10. Effective as a university teacher | 219 | 1 | 2 | 6 | 25 | 70 | 92 | 23 |
| 11. Course as a learning experience. | 219 | 1 | 3 | 4 | 30 | 67 | 74 | 40 |
In examining the distribution of responses across each core question, it is important to recognize that, historically, the distribution of responses on SQCTs tend to be skewed such that more students select the Agreement response options (i.e., Agree Somewhat, Agree, and Strongly Agree) than the Disagreement response options (i.e., Strongly Disagree, Disagree, and Disagree Somewhat; Linse, 2017; see Figure 1). If a distribution is skewed such that more students are selecting the Disagreement response options than the Agreement response options, this is important to take into consideration.
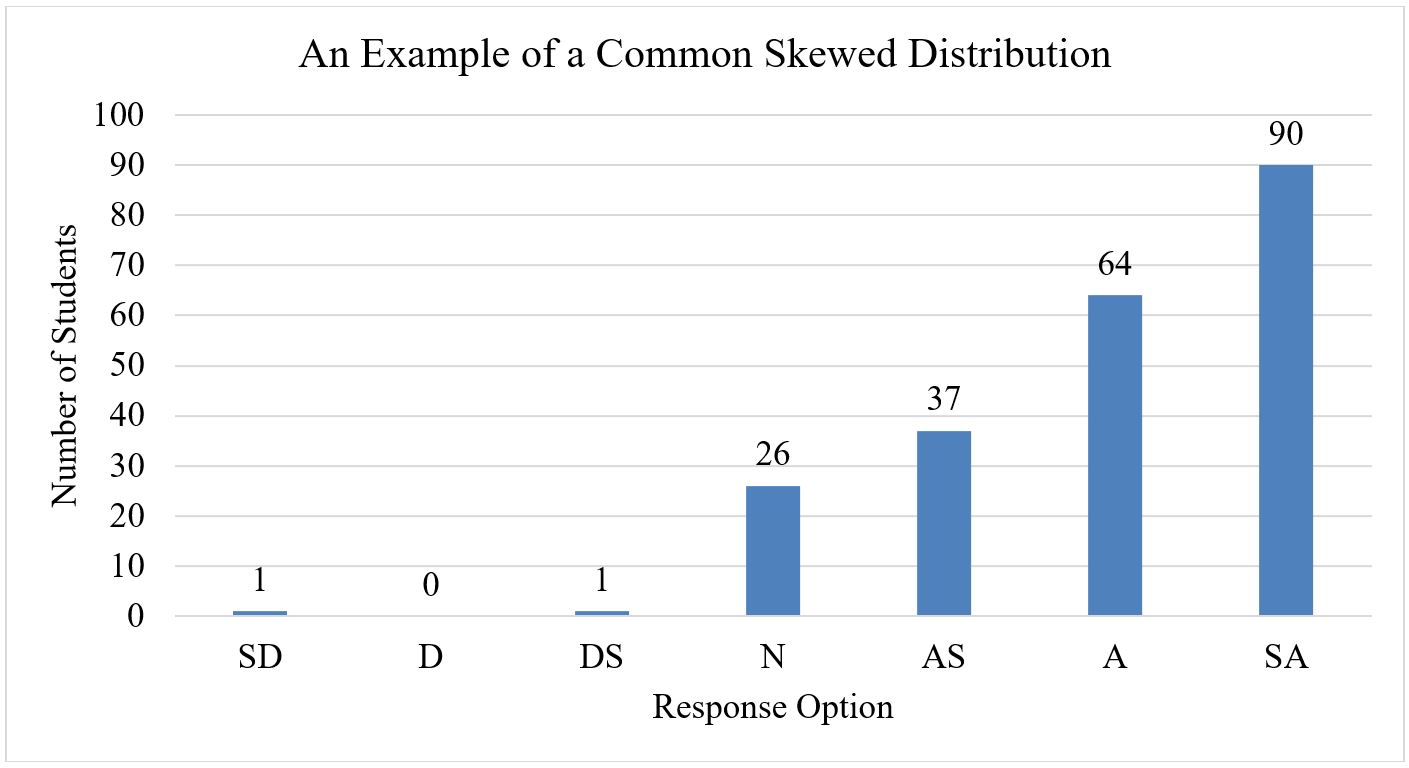
Figure 1. An example of a common skewed distribution of student responses on an SQCT question. SD = Strongly
Disagree, D = Disagree, DS = Disagree Somewhat, N = Neither Agree nor Disagee, AS = Agree Somewhat, A = Agree, SA =
Strongly Agree.
If the results have more than one peak (e.g., there is a high frequency of responses on Disagree Somewhat and another high
frequency of responses on Agree Somewhat, an example of a bimodal distribution), this may suggest that there are contextual
variables that need to be taken into consideration in understanding the results (e.g., a split of students for whom the
course is an elective and those for whom it is a required course).
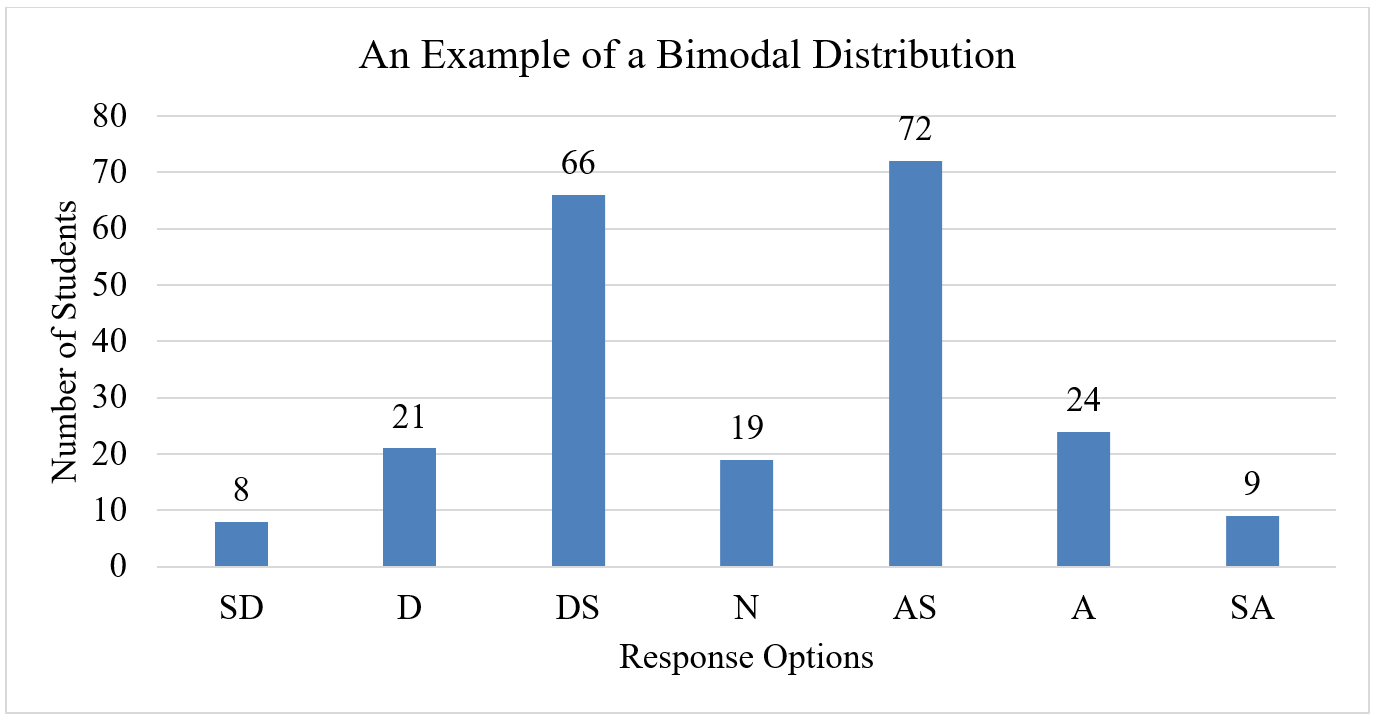
Figure 2. An example of a bimodal distribution of student responses on an SQCT question. SD = Strongly Disagree,
D = Disagree, DS = Disagree Somewhat, N = Neither Agree nor Disagee, AS = Agree Somewhat, A = Agree, SA = Strongly Agree.
Another point of consideration is outliers. In Table 1 and Figure 1 we can see that a student or two selected the response
option Strongly Disagree on a number of questions. This is a very small number of students relative to the total who
responded to the questions, and, thus, should not be given an inordinate focus. Even the very best instructors receive
a few outliers.
To get a big picture view of the distribution of scores across questions, you could create a heat map, which gives a very
sharp visual of the distribution of responses. Microsoft Excel, for example, allows the
creation of a heat map.
Copy and paste the frequencies for each of the seven response options from Table 1 into Excel and select the
Red to White Color Scale, which will result in the response options with a lower response rate to be white.
As the frequencies of responses to an option increase, the cells become a darker red. Using this approach, we can see in
Table 2 that, for 10 of the 11 questions, there are very few students who expressed Disagreement. This visualization also
highlights the contrast between those 10 questions and the question "Responds to Questions Clearly," which peaks at the
middle option, Neither Agree nor Disagree.
Table 2: Heat Map of Distribution of SQCT Responses
| Strongly Disagree | Disagree | Disagree Somewhat | Neither Agree nor Disagree | Agree Somewhat | Agree | Strongly Agree | |
|---|---|---|---|---|---|---|---|
| 1. Displays enthusiasm | 2 | 4 | 7 | 39 | 61 | 72 | 34 |
| 2. Well organized | 1 | 1 | 0 | 21 | 52 | 84 | 60 |
| 3. Presents concepts clearly | 0 | 0 | 1 | 19 | 38 | 73 | 87 |
| 4. Encourages participation | 2 | 1 | 3 | 33 | 58 | 68 | 54 |
| 5. Responds to questions clearly | 11 | 24 | 40 | 68 | 50 | 22 | 4 |
| 6. Encourages reflection | 1 | 0 | 1 | 26 | 37 | 64 | 90 |
| 7. Provides fair evaluation | 0 | 2 | 9 | 36 | 39 | 31 | 100 |
| 8. Provides helpful feedback | 2 | 0 | 0 | 0 | 11 | 55 | 151 |
| 9. Good motivator | 1 | 5 | 4 | 37 | 32 | 59 | 81 |
| 10. Effective as a university teacher | 1 | 2 | 6 | 25 | 70 | 92 | 23 |
| 11. Course as a learning experience. | 1 | 3 | 4 | 30 | 67 | 74 | 40 |
In Excel, or similar software, you can also easily create bar graphs with the results , which give a focussed visualization of the distribution for an individual question, such as the distribution for the question "Responds to Questions Clearly" (see Figure 3).
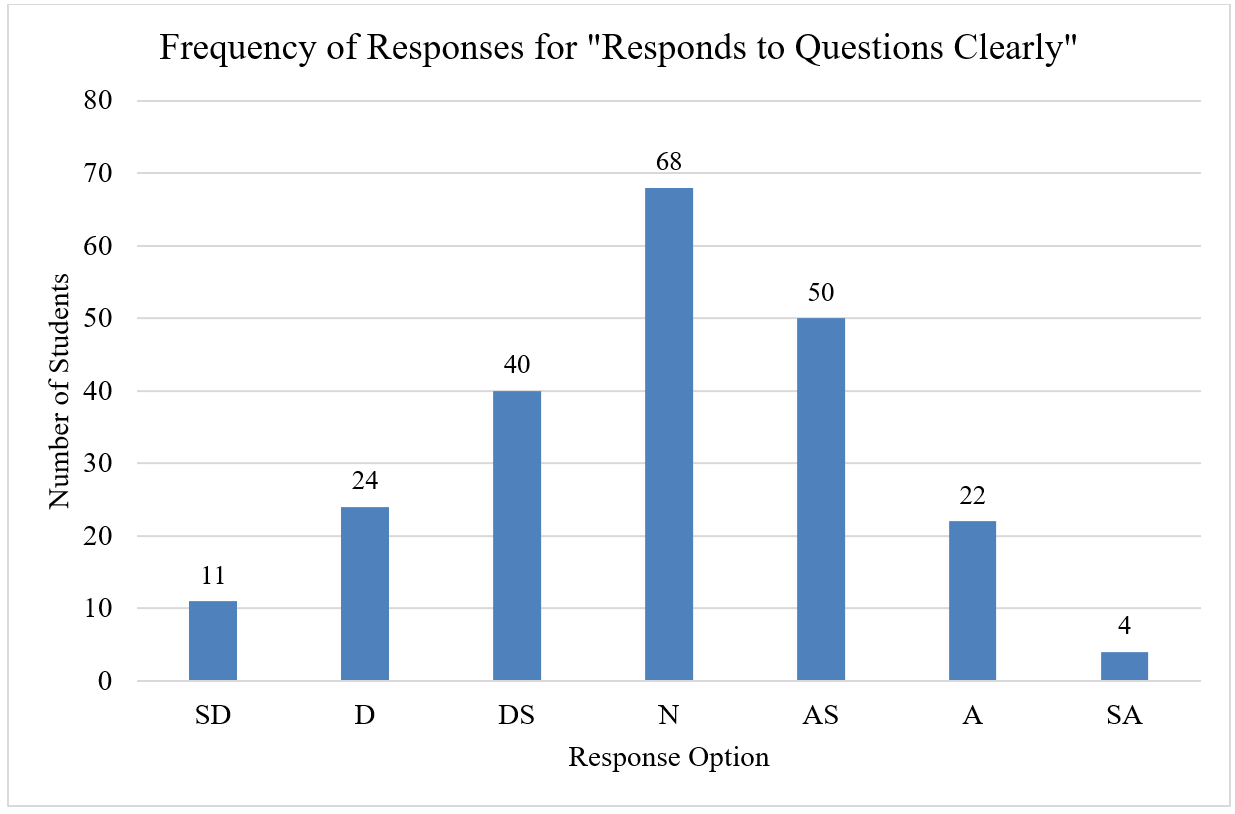
Figure 3. Frequency of responses for the SQCT question "Responds to Questions Clearly". SD = Strongly Disagree,
D = Disagree, DS = Disagree Somewhat, N = Neither Agree nor Disagee, AS = Agree Somewhat, A = Agree, SA = Strongly Agree.
Heat maps and bar graphs can be very helpful in understanding overall patterns in the distribution of SQCT responses for a
course.
Tips for Understanding Written Comments
Written comments can be a useful indicator of how instructors might plan specific future actions in relation to course
instruction because they provide qualitative feedback on students' experiences within the classroom. Western provides
resources to help instructors
talk about writing effective comments
with their students so that comments are appropriate, specific, and useful.
Instructors tend to focus on negative comments. Be sure to also acknowledge those things that students believe are good
about instruction and the course.
Students often write comments when they have a strong opinion about the course or instructor, so compare written feedback
against the ratings results to place comments in the context of the class as a whole. For example, while a written comment
might indicate one student believed evaluation practices were unfair, ratings results might suggest that the class as a
whole felt otherwise.
Likewise, a single comment might be very positive in nature, but the ratings results on a related question might suggest
that an element of the course or instruction could be improved from the students' perspective.
Look for repeated patterns in written comments and consider whether or not comments are mostly positive or negative. You
might find it helpful to group comments into categories. Remember that multiple comments about one aspect of courses and
teaching--for example, instructor enthusiasm--should be viewed as a single point of interest, not as multiple concerns or
affirmations from multiple students. This
Comments Analysis Worksheet
, developed by McGill University, may be of help.
Even though an idea in a comment might only be mentioned once, do not automatically discount it. It may reflect the view
of students from a marginalized demographic that are challenged by basic assumptions we make about the nature of teaching
and instruction.
When written comments and ratings results align, comments can be a particularly valuable source of information about what
is working well in the course as well as where you might introduce changes into the course. Discussing the comments with a
trusted colleague, your Chair, or member of the
Centre for Teaching and Learning
can help to foster new ideas for moving forward with instruction and course design.
Finally, written comments can help instructors separate concerns about instruction from elements of the course that
instructors have no control over, such as scheduling, how often the course is offered, and class size. The latter type of
comments can be brought to the attention of Chairs and Deans.
Feldman, K. A. (2007). Identifying exemplary teachers and teaching: Evidence from student ratings. In R. P. Perry & J. C.
Smart (Eds.), The scholarship of teaching and learning in higher education: And evidence-based perspective
(pp. 93-129). Dordrecht, The Netherlands: Springer.
Hativa, N. (2014). Student ratings of instruction: A practical approach to designing, and reporting (2nd ed.). Seattle,
WA: Oron Publications.
Linse, A. R. (2017). Interpreting and using student ratings data: Guidance for faculty serving as administrators and on
evaluation committees. Studies in Educational Evaluation, 54, 94-106.
https://doi.org/10.1016/j.stueduc.2016.12.004